Wednesday, 25 June 2014

Is Parameter have it's dropdown list..?

Yes, But it will be called as Compact list.


What is the criteria to blend the data from multiple data sources.?

There should be a common dimension to blend the data source into single worksheet.

For example, when blending Acutal and Target sales data, the two data sources may have a Date field in common. The Date field must be used on the sheet. Then when you switch to the secondary data source in the Data window, Tableau automatically links fields that have the same name. If they don’t have the same name, you can define a custom relationship that creates the correct mapping between fields.

Can we use Groups and Sets in calculation field.?

  • Groups: No, we can not use Groups in calculation fields.
  • Sets: Yes, we can use Sets in calculation fields.

Difference between Grouping and Sets.?

  • Groups – Combine dimension members into higher level categories.
  • Sets – Create a custom field based on existing dimensions that can be used to encode the view with multiple dimension members across varying dimension levels.

What is context filter.?

If you are applying filters to a large data source, you can improve performance by setting up context filters. A context filter is applied to the data source first, and then the other filters are applied only to the resulting records. This sequence avoids applying each filter to each record in the data source.

You may create a context filter to:

  • Improve performance – If you set a lot of filters or have a large data source, the queries can be slow. You can set one or more context filters to improve performance.
  • Create a dependent numerical or top N filter – You can set a context filter to include only the data of interest, and then set a numerical or a top N filter.

What is Dual Axis.?

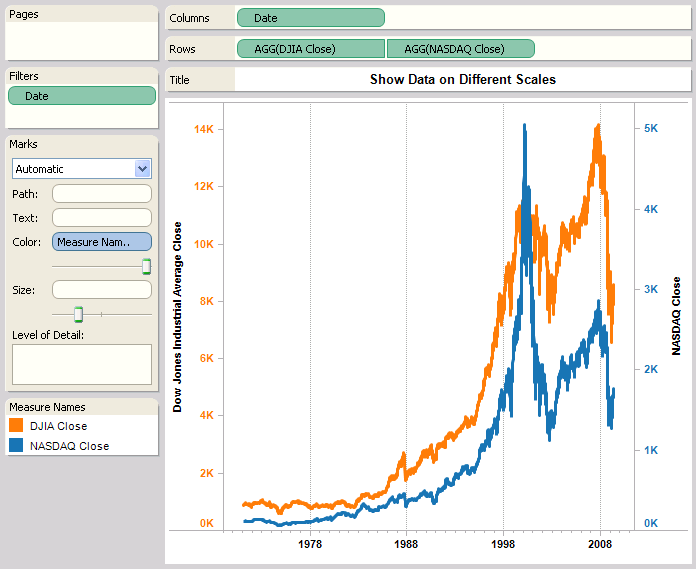
You can compare multiple measures using dual axes, which are two independent axes that are layered on top of each other. Dual axes are useful when you have two measures that have different scales.

For example, the view below shows Dow Jones and NASDAQ close values over time.

To add the measure as dual axis drag the field to the right side of the view and drop it when you see a black dashed line. You can also select Dual Axis on the field menu for the measure.


The two axes are independent scales but the marks are layered in the same pane.

Can we use Parameter in Filter.?

Yes, We can use.


Friday, 20 June 2014

What is page self..?

The Pages shelf is a powerful part of Tableau that you can use to control the display of output as well as the printed result of that output. 


Monday, 7 April 2014

How to Improve Performance in Tableau.?

1. Use an extract.
There is nothing else that comes close to the efficiency gained using an extract.  If you don't absolutely need live data, extracting is the best bet.

2. Limit your dashboard to fully answering only one scenario.
At it's simplest, a dashboard should be able to fully explore a single scenario.  If your dashboard has six sheets, five actions, and 3 quick filters, you might not be looking at only one scenario.  Remember, no matter how elegant and comprehensive your solution is, if it doesn't run as quickly as the user would like it to, he or she will not use it.  I would not recommend butchering your dashboard so heavily that it cannot fully handle a scenario.  If the user has to go somewhere else to find the answer, why did they use your dashboard at all?

3. Limit the data being introduced to each worksheet.
If you are not planning on using a set of rows, you should filter them out of the data set as early as possible.  If your table contains all sales, and you only want to look at US sales, create a Custom SQL query that filters it out.  If the filter is worksheet dependent, try using a Context Filter.  For more information on filtering, check out my other post Types of Filters in Tableau.  You can also click the Down Arrow beside the word "Dimension" and Select "Hide All Unused Fields" to hide any fields you are not using in any of your worksheets.  I'm not sure if this improves efficiency; but I'd have to imagine that it does, less data should always improve performance.

4. Remove components that add no value.
While aesthetics are very important to building a usable dashboard, unimportant objects aren't worth losing efficiency over.  In fact, you would be better off adding more functionality than you would by adding a purely aesthetic object.

5. Eliminate any non-essential components from the visualization.
This refers to values that would appear on the Pages, Filters, and Level of Detail Shelves.  If they are purely there for the user to see if they scroll over a point, then they aren't adding any value to the initial glance.  However, I leave this as the last step because it should be a last resort.

In most cases, a little forethought can save you a lot of heartache when you are creating dashboards.  Decide exactly what story you want to tell, and tell only that.  It is much easier to add functionality to a small dashboard, than to butcher a large one.  Thanks for reading.

How many types of filters are there in Tableau.?

In Tableau, there are three types of filters.  More explicitly, there are three different ways to limit the data that is displayed by your graph. Each of these has its own strengths and weaknesses, and we will look at them one at a time.

These types are
  1. Custom SQL "Filters"
  2. Context Filters
  3. Traditional Filters.  
Custom SQL Filters:
Custom SQL "Filter" is a WHERE clause that is placed in the SQL that queries the data to be used in the workbook.  "Filter" is a Tableau term that technically applies only to Context and Traditional Filters; however, the Custom SQL "Filter" emulates the behavior of a global Context Filter, so we will refer to it as such.  By construction, Custom SQL "Filters" are always global.  The most common reason for using a Custom SQL "Filter" is to limit the size of a data extract.  The smaller your data extract, the more quickly your charts will load.  In other words, you can make more complex charts without sacrificing efficiency.

One of the ways to create a Custom SQL "Filter" is during the Server Connection process.

Context Filters:
a Context Filter is a filter in Tableau that affects the data that is transferred to each individual worksheet.  Context Filters are great when you want to limit the data seen by the worksheet.  When a worksheet queries the data source, it creates a temporary, flat table that is uses to compute the chart.  This temporary table includes all values that are not filtered out by either the Custom SQL or the Context Filter.  Just like with Custom SQL "Filters", your goal is to make this temporary table as small as possible.

Context Filters have a few advantages over Traditional Filters.  First, they execute more quickly than Traditional Filters.  They are also executed before Traditional Filters and can be executed all at once, which further improves efficiency.  However, they do have one drawback.  It takes time for the filter to be placed into context.  A rule of thumb, from Tableau's KnowledgeBase, is to only place a filter into context if it reduces the data by at least 10%.

A Context Filter is created by dragging a field onto the "Filters" Shelf and editing the filter.  Then, you can Right-Click the field on the shelf and select "Add to Context."  If you have multiple context filters, you can CTRL-Select them all and add them to context in a batch.  This will improve the efficiency of your filter.

Traditional Filters:
Traditional Filter is exactly what most people think of when they think of filters.  When Tableau is creating the visualization, it will check to see if a value is filtered out by a Traditional Filter.  Since this is not performed at the table level, it is the slowest of all filter types.  However, it does have the advantage of being performed after the Context Filters.  This is a necessity if you are dealing with complex "Top N" filters.  A Traditional Filter can be created by simply dragging a field onto the "Filters" Shelf.