Wednesday, 25 June 2014
What is the criteria to blend the data from multiple data sources.?
There should be a common dimension to blend the data source into single worksheet.
For example, when blending Acutal and Target sales data, the two data sources may have a Date field in common. The Date field must be used on the sheet. Then when you switch to the secondary data source in the Data window, Tableau automatically links fields that have the same name. If they don’t have the same name, you can define a custom relationship that creates the correct mapping between fields.
For example, when blending Acutal and Target sales data, the two data sources may have a Date field in common. The Date field must be used on the sheet. Then when you switch to the secondary data source in the Data window, Tableau automatically links fields that have the same name. If they don’t have the same name, you can define a custom relationship that creates the correct mapping between fields.
Can we use Groups and Sets in calculation field.?
Difference between Grouping and Sets.?
- Groups – Combine dimension members into higher level categories.
- Sets – Create a custom field based on existing dimensions that can be used to encode the view with multiple dimension members across varying dimension levels.
What is context filter.?
If you are applying filters to a large data source, you can improve performance by setting up context filters. A context filter is applied to the data source first, and then the other filters are applied only to the resulting records. This sequence avoids applying each filter to each record in the data source.
You may create a context filter to:
You may create a context filter to:
- Improve performance – If you set a lot of filters or have a large data source, the queries can be slow. You can set one or more context filters to improve performance.
- Create a dependent numerical or top N filter – You can set a context filter to include only the data of interest, and then set a numerical or a top N filter.
What is Dual Axis.?
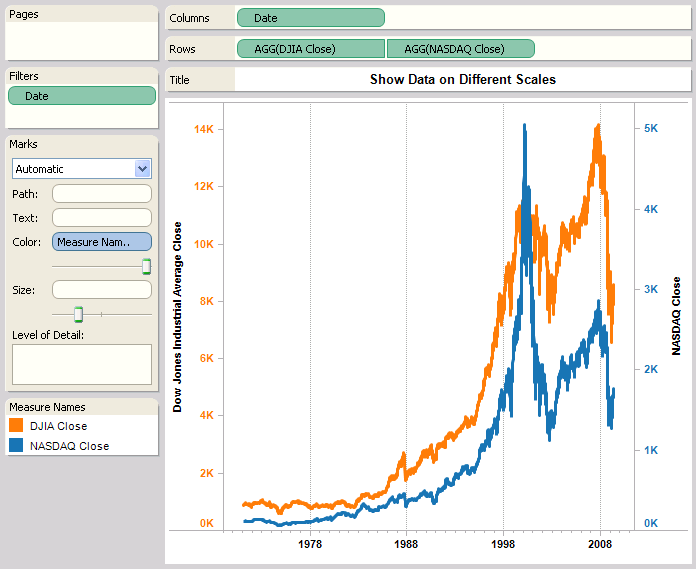
You can compare multiple measures using dual axes, which are two independent axes that are layered on top of each other. Dual axes are useful when you have two measures that have different scales.
For example, the view below shows Dow Jones and NASDAQ close values over time.
To add the measure as dual axis drag the field to the right side of the view and drop it when you see a black dashed line. You can also select Dual Axis on the field menu for the measure.
The two axes are independent scales but the marks are layered in the same pane.

For example, the view below shows Dow Jones and NASDAQ close values over time.
To add the measure as dual axis drag the field to the right side of the view and drop it when you see a black dashed line. You can also select Dual Axis on the field menu for the measure.

Friday, 20 June 2014
Subscribe to:
Comments (Atom)


